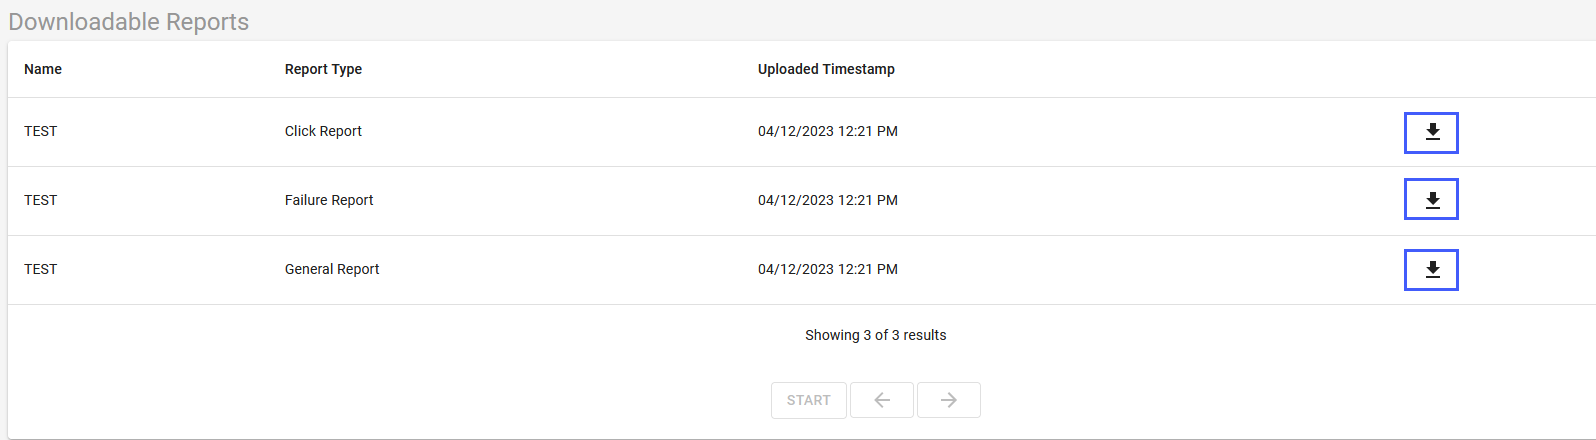
- Select a Communication Channel
- Select a Default Report Filter
- Select Notification Types
- Select Notification Sub-type(s) (if needed)
- In Series select the information you want projected on the graph
- If you select Dates from the calendar, it supersedes the selection you made in the Default Report Filter
- Select Retrieve Report Data
Image:
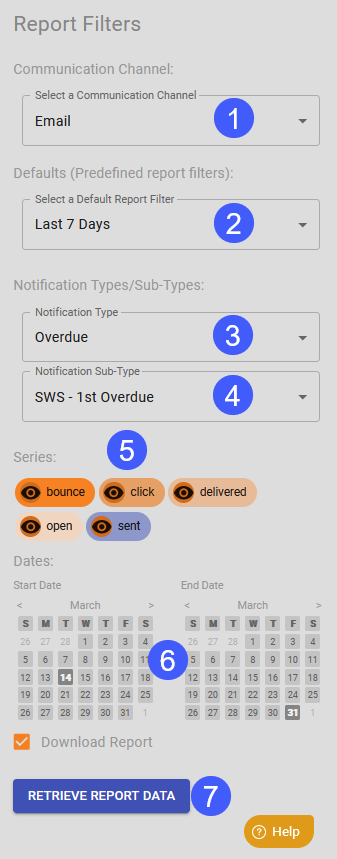
Your results will include a graph and a breakdown of the information below it. Use the selections under Series to modify the display of the graph.
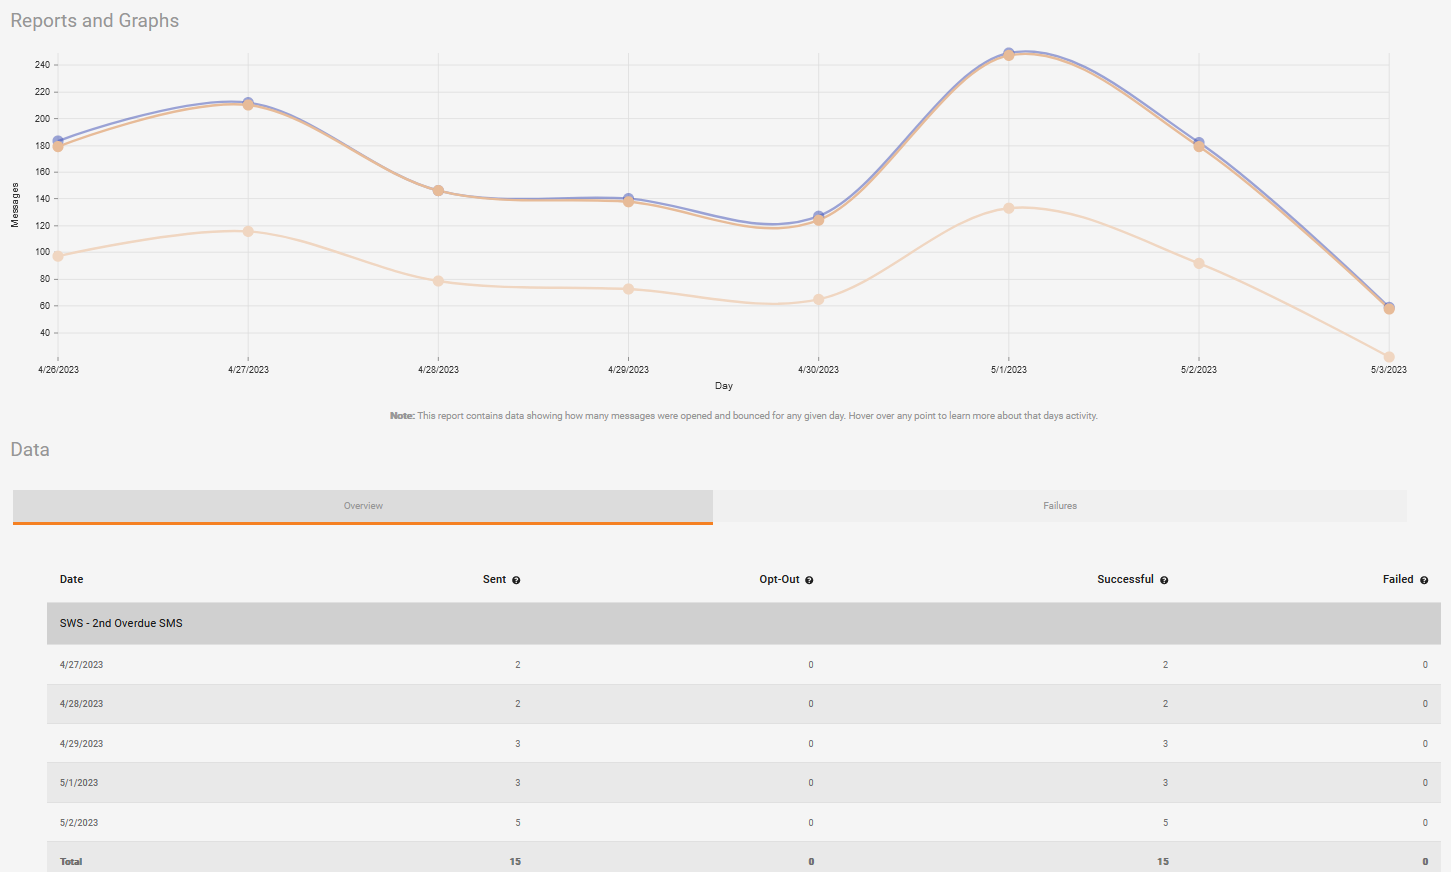
If you Download the report and selected multiple items in the Series filter you may be notified that the file is too large and needs to download. When it is available you will find it in the Downloadable reports area. For newly run reports you will get an indication over the icon of the envelope at the top of your screen which you can also click on to retrieve your report.
Image:

Click the download icon on the far right to view your report.